Explanation of Exam 1 curving
The grade written on your exam consists of a raw score out of 75 in pink, converted to a percentage in blue followed by a curved percentage in blue.
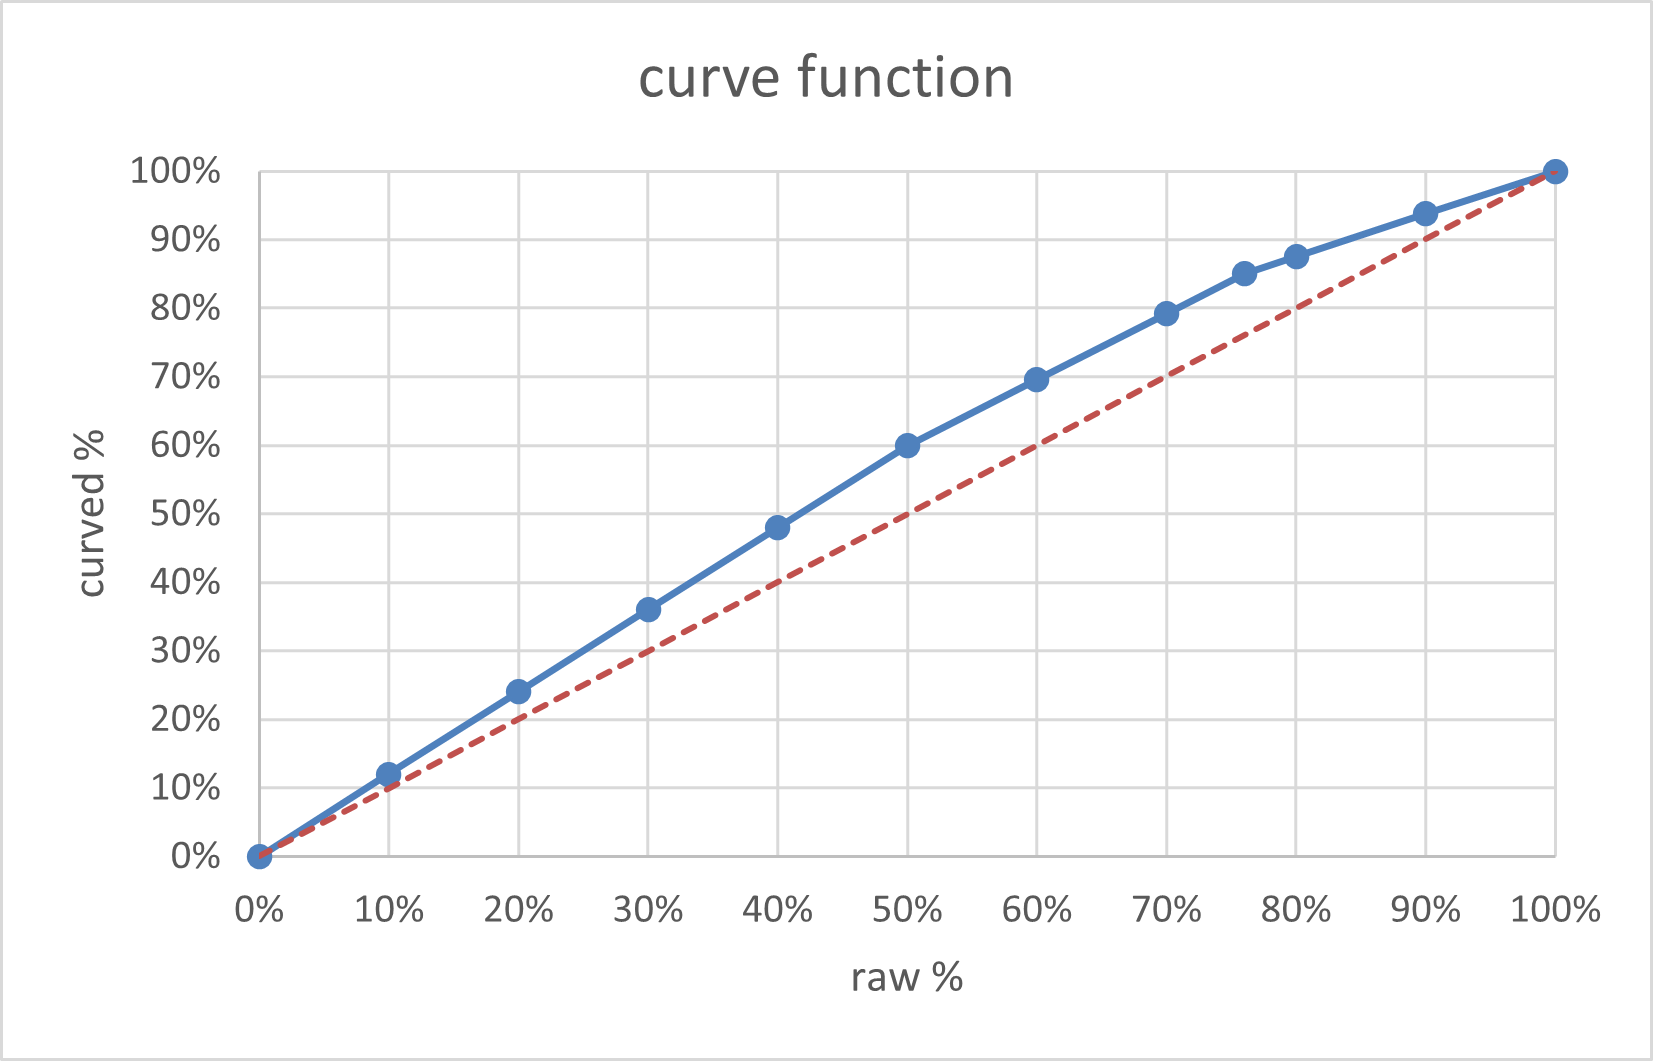
The curve was a piecewise linear function with the following properties: 0 maps to 0, 50 maps to 60, 76 maps to 85, 100 maps to 100. These values were chosen so that the raw median of 76 would map to a B grade (85%, a fair reflection of achievements of the median student) and my estimate that scoring a raw 50 percent represented a passing grade.
Here’s a graph of this function: